
THE MAGNETOMETRY SURVEY
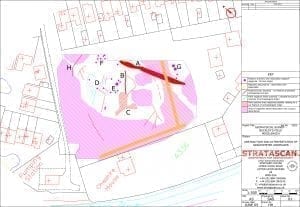
The anomalies identified within the survey area indicated in Figure 7 can be separated into the following categories, discussed individually below:
- Positive anomalies with associated negative responses – near surface ferrous (iron) objects
- Magnetic disturbances associated with services
- Positive linear anomalies – possible cut features of archaeological origin
- Faint negative linear anomalies – possible structural remains of archaeological origin
- Faint positive area response possibly relating to a cut feature of archaeological origin
- Areas of magnetic disturbance associated with modern activity
Positive anomalies with associated negative response
These positive anomalies with negative responses are likely to represent near surface ferrous objects and can be identified in three clusters within the north of the survey area (E, F and G). These responses may be archaeological in origin as the site history revealed evidence of iron smithing in the area, although due to the site’s urban location these anomalies may also be of modern origin.
Magnetic disturbances associated with services
Two services have been identified within the survey area and have contributed to the areas of magnetic disturbance. One service runs parallel with the south-western field boundary. The other runs on a northeast-southwest orientation across the eastern side of the survey area.
Positive linear anomalies – possible cut features of archaeological origin
A large positive linear anomaly was identified on an approximate north-south alignment crossing the north-eastern corner of the survey area (A). This anomaly may represent a cut feature of archaeological origin, such as a ditch, and may be associated with a Roman road believed to run across the site.
A smaller positive linear anomaly was identified across the centre of the survey area aligned roughly northeast-southwest. The anomaly was around 15m long (B). This anomaly may represent a cut feature of archaeological origin.
A number of faint positive linear anomalies situated to the west of anomaly E and southeast of B may represent cut features of archaeological origin. Due to the large areas of magnetic disturbances surrounding the perimeter of the survey, it is difficult to abstract a coherent alignment of anomalies that would indicate possible archaeological structures or features. These anomalies may therefore be of archaeological or modern origin.
A positive linear response can be seen through the magnetic disturbance in the north corner of the survey area (H). This anomaly may represent a cut feature of archaeological origin.
Faint negative linear anomalies – possible structural remains of archaeological origin
A number of faint negative linear responses have been identified in the north-western part of the survey area, mainly in a northeast to southwest alignment (D). These faint anomalies may represent structural remains of archaeological origin or possibly be associated with modern or agricultural activity.
Faint positive area response possibly relating to a cut feature of archaeological origin
In the approximate centre of the survey area is a faint positive area response (C). This anomaly may represent a cut feature of archaeological origin and may indicate a continuation of linear anomaly B.
Areas of magnetic disturbance associated with modern activity
The survey data is dominated by large areas of magnetic disturbance caused by the nearby field boundaries, identified services and the tree and barrel situated in the northeast of the survey area. These areas of magnetic disturbance may have obscured the presence of faint linear anomalies of possible archaeological origin.
It is also difficult to separate potential magnetic disturbances of possible archaeological origin associated with metal working from modern activities. It may be possible that some of the magnetic disturbances could be caused by archaeological activity, such as smithing. Anomalies of archaeological origin may also be masked by the magnetic disturbance. This is represented by two possible strong positive anomalies, one situated in the north corner near anomaly (H) and the other situated in the west corner of the survey area. These anomalies may be of archaeological origin but masked by modern disturbances.
THE RESISTIVITY SURVEY
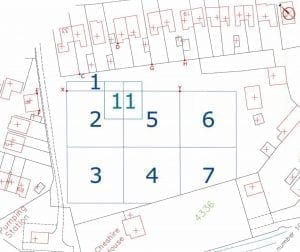
Two sets of data were collected using the resistivity technique. Readings were taken at 1.0m intervals within grids 1-7, and a more detailed survey at 0.5m intervals within grid 11 (see Figure 8)
Data collected at 1.0m intervals (Grids 1-7)
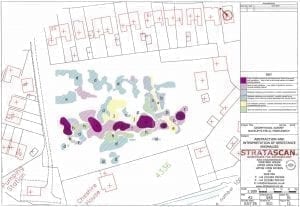
The anomalies identified within the survey area can be separated into the following categories indicated in Figure 9:
- Faint linear medium value resistivity feature
- Moderately high resistance areas
- High resistance areas possibly associated with modern activity
- Areas having moderate and low resistance values
The resistivity survey results showed few anomalies that can be confidently associated with archaeological activity.
Faint linear medium value resistivity feature
At the south-eastern end of the field a thin (1m wide) linear feature of moderately low resistance extends from the north-eastern to the southern boundaries of the survey area in an approximate north-south direction (a). This is likely to be associated with the service also found by the magnetometry survey.
Moderately high resistance areas
The areas marked as (b) have moderately high resistance values and appear to be associated with the thin linear feature (a) described above. Due to the pattern of these areas and their close proximity to the faint linear, it is possible that they are due to changes to drainage patterns connected with the service trench.
The areas of elevated resistance marked (d) do not form any discernable pattern and are consequently thought to be the result of geological or pedological processes. Area (e) appears to coincide with a surface scatter of modern building material.
High resistance areas possibly associated with modern activity
An irregularly shaped discontinuous band of high resistance (f) is evident across the site. It is oriented in a northwest-southeast direction and varies in width from approximately 5m at its narrowest to nearly 20m at its widest. The area appears to correspond with the break of slope leading down to the River Croco and may be caused by landscaping to extend the level area of the field. In the southern corner of the survey area this band (f) of high resistance is cut by the faint linear (a) and the associated area of medium resistance (b) which may indicate that the landscaping predates the excavation of the service trench. Within the band of high resistance there are areas (g) that exhibit resistance values significantly higher than the surrounding values. It is possible that these areas have structural origins; however it is also possible that they are related to the landscaping.
Two areas (c) near the bushes in the centre of the survey area show raised resistance levels possibly due to the reduction in soil moisture around the plant roots.
Areas having moderate and low resistance values
The south-western and south-eastern areas that slope down towards the River Croco generally have lower soil resistance values than the rest of the site, and would appear to reflect pedological processes. Within this general vicinity there are areas with lower resistance (h and j); these anomalies may indicate cut features such as pits, ditches, quarrying or dumped material with heightened porosity of archaeological origin.
DATA COLLECTED AT 0.5M CENTRES (GRID 11)
 After discussion with the on-site archaeologist it was agreed that a 20m x 20m grid numbered 11 would be located in the area that was to be excavated during the community dig. The results show more detail, but it is difficult to interpret the data.
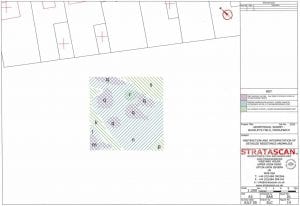
The interpretation of the detailed resistivity survey is given in Figure 10.
The initial survey at 1m centres indicated a 10m wide band of generally medium resistance values aligned north-south with moderately low resistivity values to the east and west of it. The detailed survey confirms this general impression, but within the medium-resistance band (n) there are patches of higher resistance values (q). It is possible that these areas represent structures of archaeological origin, but they are more likely to indicate variations in the underlying geology, or are caused by landscaping. The discrete low resistance area (r) could be caused by a 3m diameter pit, or could have a geological origin. The remaining areas of low resistance (k, p and s) appear to have the same range of values as the general background of the site, although it is possible that the area which also appears faintly in the larger resistivity survey could be a cut feature of archaeological origin (k).
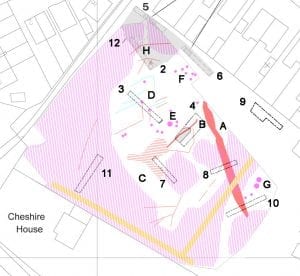 On completion of the fieldwork in the summer of 2005, the results of the trial trenching and excavation were compared with the geophysical surveys to assess the effectiveness of the differing techniques. Figure 11 indicates the final trench locations in relation to the magnetometer survey.
It is interesting to note that evaluation Trenches 3, 7, 8 and 10 failed to locate any significant archaeology whatsoever, despite being situated specifically to test for strong anomalies in the data plot.
Trench 11, located on the slope down to the River Croco near Cheshire House identified a large build-up of re-deposited boulder clay. It is suggested that the areas of magnetic interference which are extensive across the field have been caused by this clay, which may have come from the excavation of the canal channel for the River Croco.
The geophysics failed to locate the backfill of John Bestwick’s trench in the northern corner of the site, which was discovered in Trenches 2 and 12. Similarly neither geophysical survey picked up the archaeological features seen in Trenches 4 and 12.
These results were assessed by David Jordan, formerly of Terra Nova Ltd, as part of a study into the effectiveness of geophysical surveys in the North West. The detailed report is available at http://www.terranova.ltd.uk/Effective%20Geophysics.pdf (the Buckley’s Field case study starts on page 49).
Three reasons are identified why the geophysics in this instance was inconclusive:
- The abundance of disturbance, debris and metal constructions around the site produced a strong pattern of anomalies which made it impossible to resolve the smaller anomalies due to archaeological remains nearby.
- The excavation showed that the archaeological remains, though extensive, were buried to a depth of more than 50cm and many of the strongest geophysical boundaries lay at significantly greater depths. The stratigraphy was also quite complex and three-dimensional, which tends to obscure the detail of individual features when conflated to the 2- dimensions of a standard geophysical survey, even where they lie close to the surface – and even more so where they lie at depth. The result is that the detectable anomaly contrast, due even to these significant remains, will have been weak at the ground surface whatever 2-dimensional technique was used.
- Many of the archaeological remains here are broad spreads of material with only diffuse vertical boundaries. Our normal geophysical survey techniques detect these much less well than boundaries between cut (ditch, pit) or built (wall) structures within contrasting materials, most often the natural soil.
These factors combined means that the survey techniques employed at Buckley’s Field were relatively ineffectual. The suggestion in this instance is that a third technique- Ground Penetrating Radar- may have proved more effective in identifying deeply buried remains, though this cannot be guaranteed.